Juan de Fuca Geomancy Study 2019 to 2023

An intriguing feature of Geomancy is the ability to do readings of future events – When will something happen? A good way to look into this would be to pick an event that is certain to happen in the near future (say within 10 years or so), which cannot be predicted with certainty, and which would be a huge benefit if we could know when it will occur.
The Juan de Fuca Plate Slip
The Juan de Fuca Geological Plate meets up with the North American Continental Plate in a 700-mile-long junction off the West Coast from Oregon to Vancouver BC Canada. For the past 10,000 years, the Juan de Fuca Plate builds up pressure that raises the height of the North American Plate along the coast. Every 243 years, on average, the pressure lets go and the West Coast along the junction plunges downward by 6 feet, creating an earthquake and a tidal wave.
If you live anywhere near this part of Northwestern North America, I urge you to read up on this geological certainty. It may save your life to do so. Here is a link to a well-written article on the subject:
https://transsexy.geophys.mcgill.ca/~olivia/EES/2018-Winter/The%20Really%20Big%20One.pdf
And a citation:
Schultz, K. The Really Big One. An earthquake will destroy a sizable portion of the coastal Northwest. The question is when. New Yorker Magazine, 2015 Jul 20.
How does this relate to Geomancy?
We can be certain that the Juan de Fuca earthquake and tsunami will occur. Since the last one happened in January 1700, the next one was due in 1943. It is now 81 years overdue, and no one knows exactly when it will happen. This makes it a perfect candidate for trying out Geomancy as a means to predict the quake. Even knowing the year of occurrence would be very helpful!
In 2019, I planned to do a series of Geomantic readings on the question, “How many years until the Juan de Fuca plate slip will occur?”
In Statistics and other sciences, we can do formal, logical studies of different questions. How will we know if our results mean something?
It could be that there is no benefit to doing a Geomancy reading on this topic. What would that look like? We can make a statement to describe it, called a “Null Hypothesis;”
Null hypothesis: If Geomancy is of no use to predict timing, we could expect a random distribution of predicted times. The possible range of responses, described on page 148 -149 of Greer JM, ‘The Art and Practice of Geomancy,’ (APG) is 1 to 120.
What would it look like if there is some benefit to Geomancy, in this case? We make another statement called the “Hypothesis” to describe this;
Hypothesis:
If Geomancy can be used to predict timing of the Juan de Fuca plate slip, we could expect to see a grouping of results around the actual date of the event.
Next step: Come up with a reasonable plan of study to see which of these ideas will better describe the results.
Procedure: Do a geomantic reading on the above question every 6 months for several years. If Geomancy can predict the date of the next Juan de Fuca plate slip, the results of the readings will gradually change. Different figures will point to the same general or specific date.
Before casting, specify House Chart, Quesited as House IV (because it is a geologic question), and record the date of casting.
Cast the Geomantic Reading in the usual way.
The figure in Quesited House IV is compared to the list on pages 148-149 of APG. Usually this results in two numbers.
Add the total number of points in the sixteen figures of the chart (including the Reconciler) and divide by 96. Multiply this fraction by each of the two numbers and calculate the fractional part of the year for each number.
Example:
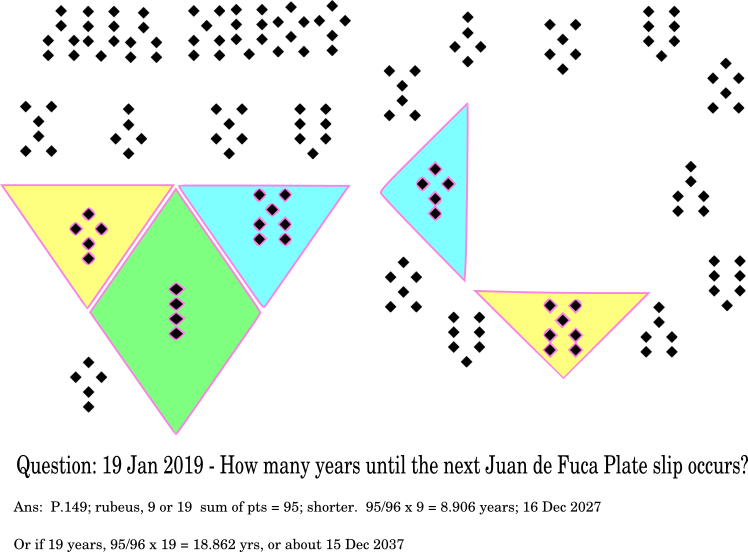
On March 8 2023, you cast Puer, Amissio, Acquisitio, and Via for the 4 Mothers. Via is in House IV, so the numbers are “2" or “5." There are 89 points in the 16 figures, so 2 x 89/96 = 1.85 years, and 5 x 89/96 = 4.64 years.
1.85 years from March 8 2023 is Jan 13 2025.
4.64 years from March 8 2023 is Oct 27, 2027.
Georatio.com provides an online tool to generate the charts and count the points. It will also count the points and tell you if the chart is perfected.
Invitation to participate
Before you look at the data I have collected (below), I invite anyone who is interested to do their own Geomantic chart on the Juan de Fuca event, and post it in a comment below.
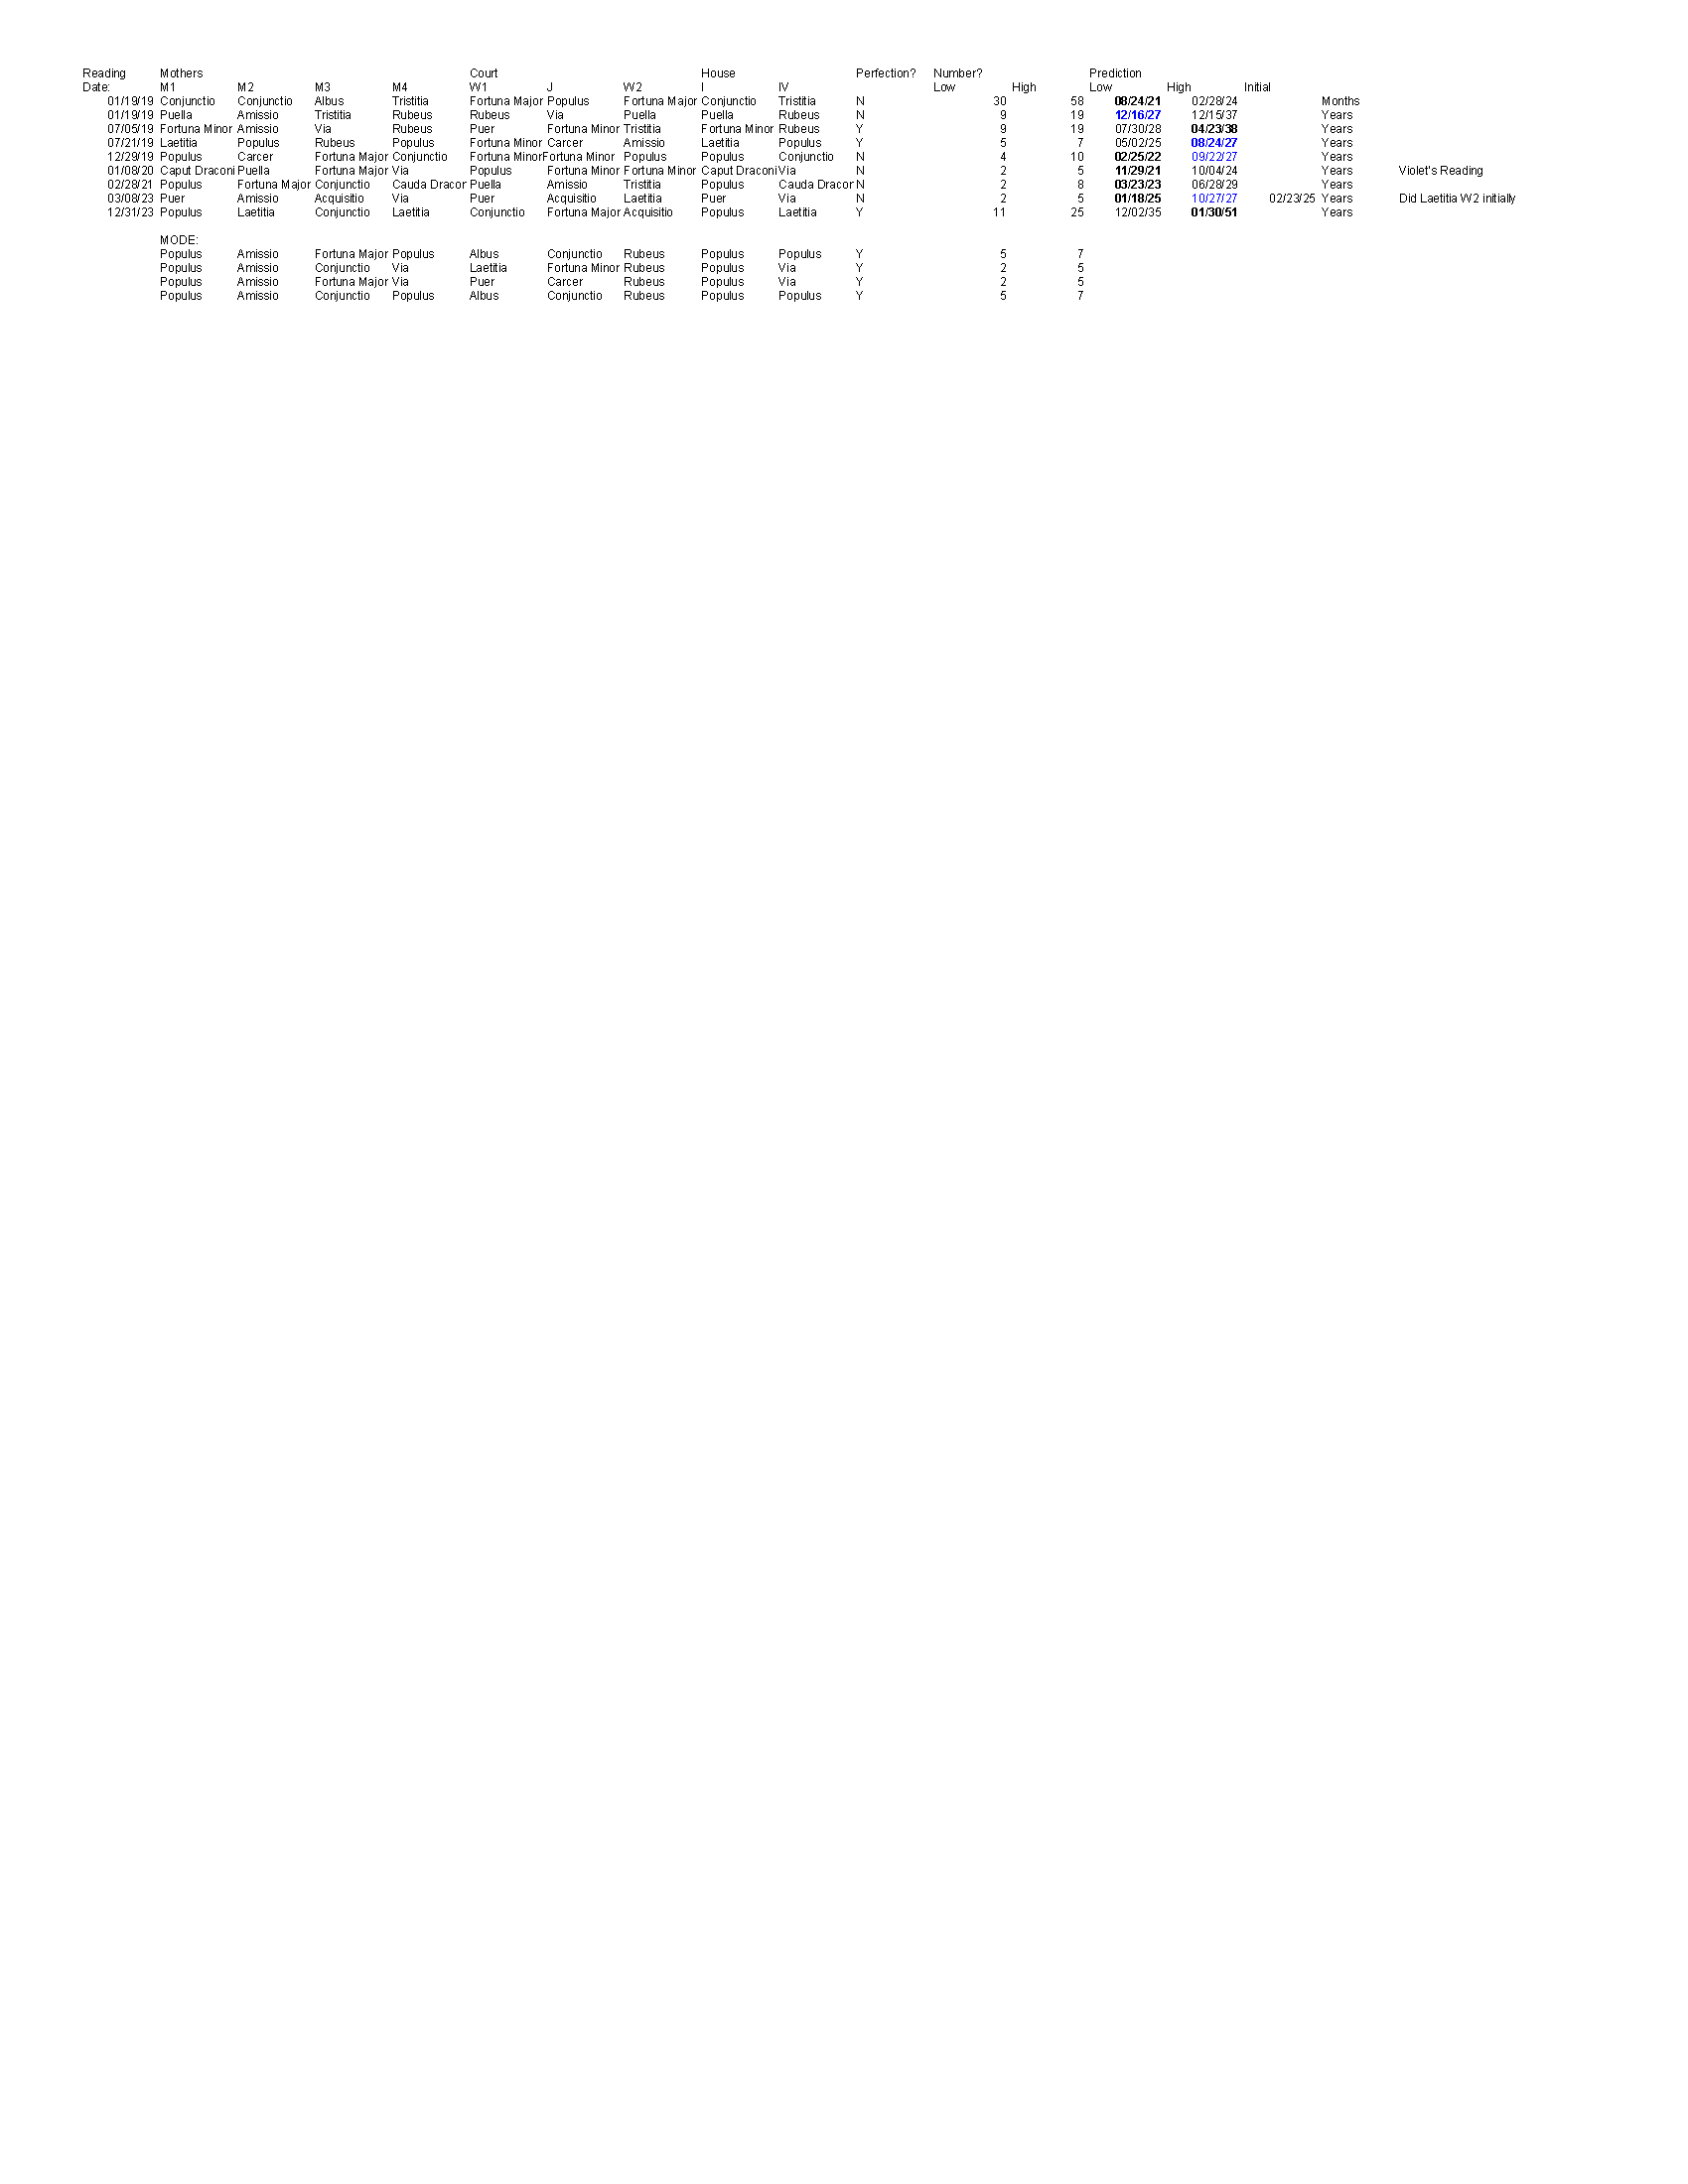
Data:
I collected 9 readings over 5 years from Jan 19 2019 to Dec 31 2023. Predicted date pairs appear at the end of each line. There is a procedure outlined in APG to pick one or the other of the two numbers, based on whether the chart perfects and whether you want the event to happen sooner or later. For this study, I put all the results into the data set, although this may make the results appear more random that they otherwise might.
Results were tabulated by year and appear in the chart below the data.
Analysis:
Predicted years for the event ranged from 2021 to 2051. 14 of the 18 data points appeared between 2021 and 2029. There were 4 readings with the year 2027. All other readings had either 2 or 1 reading in a year. Within the most concentrated zone of results, only year 2026 had no results.
I also tabulated the figures that appeared most often in each of the Mothers. For M1 and M2, it was clearly Populus and Amissio. M3 was tied between Fortuna Major/Conjunctio, and M4 was tied between Populus and Via. There are four possible charts from these combinations, resulting in Populus (5 or 7 years) and Via (2 or 5 years) in House IV.
Possibly useful–But what date do you count from?
Traditionally, repeating readings on exactly the same question is discouraged. Once per question is the recommended procedure. Since this is an important question that affects a very large number of people, and since I don’t stand to gain anything personally from it, I was hoping that Spiritus Mundi would tolerate the repeated questions.
Conclusion:
At this writing, 2021,2022, and 2023 have passed without a Juan de Fuca event. The theoretical range of possible answers, 120 years, would have spanned 2019 to 2138.
It appears that most results have grouped in 9 years, with 2027 as the most predicted year for the Juan de Fuca Event. Dates in 2027 occurred in the last third of the year (Aug 24, Sept 22, Oct 27 and Dec 16).
Curiously, 2026 has no results but is in the center of the largest number of results.
Based on these results, it looks like Geomancy could be useful for predicting events, though not with much precision. Fall 2027 looks like a particularly bad time to be in the Pacific Northwest. If you live there and this is accurate, you have almost three years to find somewhere else to live. If you live there and this is not accurate–Still move out of there as soon as possible, especially if you live near the coast. The Juan de Fuca plate slip will certainly occur again, as it has done about 70 times in the last 10,000 years. It is more than 80 years overdue at this writing. With or without Geomancy, no one needs to be a part of this upcoming tragedy.